Aloha Duane Shimogawa (Pacific Business News), (with .cc to the PUC, Champlain Wind Company, Pat Caldwell and Derek Wroe (NOAA), Steve Bussinger (UH Meteorology), HECO, Kathleen Pahinui (President, North Shore Neighborhood Board), Surfrider, Senator Riviere, and Representative Quinlan):
Thank you for your article, published yesterday, addressing wind farm effects to Sunset Point’s wind conditions (http://www.bizjournals.com/pacific/news/2017/03/07/wind-farm-developer-responds-to-claim-of-project.html “Wind farm developer responds to surfers’ claim of project hurting wave conditions at Sunset”). The information we provided at the February 2, 2017, PUC meeting in Kahuku was quite general – a more specific assessment of wind farm effects to the Sunset Point area winds was posted online at: https://surfers4solar.org/2017/02/05/na-pua-makani-winds/
Just now, shown below, we refined the analysis to use the 2014-2017 period you refer to in your article as the “after” period for operation of the Kahuku Wind Farm and we found the results are the same: the dramatic loss of east winds at Sunset Point is due to something well beyond the minor contributions of natural variability and climate change. The dramatic decrease in winter daytime east/offshore winds frequency and velocity we’re experiencing at Sunset Point is not reflected in the 2014-2017 wind data collected at the James Campbell weather station, one mile upwind from the wind farm. Nor is the dramatic increase in prevalence of side-onshore ENE and NE winds at the Sunset Point surf spots. The east winds we’re sorely missing at Sunset Point during our winter (October 1 through March 31), daytime (8 am to 3 pm) surf season are still present upwind from the wind farm. All of our analyses, to date, refer to these winter months and these daytime hours when winds had been most predictable and reliable. In addition, below we provide new data from a “backyard” weather station a Civil Defense engineer has been operating at his home on Sunset Point since 2015 of interest, even though the wind sensors don’t meet NOAA scientific standards. (The “backyard” weather station belongs to William Osborn; I met him two weeks ago; a building at Comsat is named after him because he was an engineer there for almost 40 years; he is a ham radio operator: KH6KV, his email is [withheld from this public post]@hawaii.rr.com). Here is today’s refined analysis using your 2014 to 2017 analysis period:
Percentage of hours the James Campbell weather station recorded East, ESE, or SE (which are offshore for our local surf breaks) winds:
– before (2002-2009): 47.3% of hours;
– 2014 through present: 40.9% of hours (This slight decline of E, ESE, and SE wind frequency at the “control” site doesn’t reflect the significant reduction in east winds detected at the surf spots).
Percentage of hours the backyard weather station at Sunset Point recorded these East, ESE, or SE winds: 7.6% (!)
Percentage of hours the James Campbell weather station recorded light East, ESE, or SE winds (1-13 mph, offshore winds for surfing):
– before (2002-2009): 15.8% of hours
– after (2014-present): 17.6% of hours. One mile upwind from the wind farm, the east, offshore light winds that are ideal for surfing are more frequent in the 2014 to present period than the pre-wind farm construction period.
Percentage of hours the backyard weather station at Sunset Point recorded light East, ESE, or SE winds since it began operation in 2015: 7.6% of hours (!)
Percentage of hours the James Campbell weather station recorded ENE and NE winds (side shore and side-offshore wind directions less favorable for surfing at many Sunset Point (and North Shore) surf spots):
– before (2002-2009): 23% of hours;
– after (2014 – present): 17.2% of hours (an actual reduction in ENE and NE wind frequency, consistent with UH’s climate change publication). The weaker flow of east winds seems related to this filling in of ENE and NE winds.
Percentage of hours the backyard weather station, installed in 2015 at Sunset Point, recorded these wind direction conditions: 57.5% of hours (!).
Regarding the strength of the E, ESE, and SE (offshore winds): Wind surfers are the most reliant on offshore (E, ESE, and SE) winds of high velocity. During the 2014 to present time period, E, ESE, and SE winds of these higher wind speeds were extremely rare at Sunset Point. The percentage of total winter surf season hours with E, ESE, or SE winds 19-25 mph (for wind surfing) felt at the James Campbell weather station:
– 2002-2009: 10.4% of hours;
– 2014 to present: 6.7% of hours. That these windsurfing winds still occur 6.7% of hours at the weather station on the windward side of the wind farm is remarkable, because during the 2014 to present time period, we have rarely received those winds here, three miles downwind from the wind farm.
Percentage of hours the backyard weather station installed in 2015 at Sunset Point recorded these conditions: 0.7% of hours (!!).
Climate change has certainly resulted in historic changes in windsurfing winds, but it doesn’t explain the recent significant reduction in east winds: In the 1980s, conditions at Backyards were excellent for wind surfing approximately three days a week; in the 2002-2009 period, conditions at Backyards were excellent for wind surfing approximately once per week and those conditions held for long periods of the day. In the 2014-2017 period, conditions have been suitable for wind surfing an average of once per month; the wind conditions often last for only a few short hours; and wind surfers very often now rely on using their lightest boards and larger sails for conditions to even be sailable. The reduction in the observed frequency of strong offshore E, ESE, and SE winds used by wind surfers has been strikingly more dramatic (as informally evidenced by the 0.7% of hours statistic from the “backyard” weather sensor) than the relatively small reduction documented at the James Campbell weather station for the 2014 – present period.
All of this wind data is available to the public; wind rose software can be downloaded free. Data download and software installation takes 30 minutes the first time of use; subsequent looks at the data, like what we did today, take literally five minutes. We would be happy to help you download the software and weather data so you can assess the data independently in any way you’d like.
Given the changes observed at Sunset Point in relation to the data presented here, surfers have cause to be concerned about the installation of a second, even taller, wind farm upwind from the North Shore’s important surf spots. Sunset Point’s very dramatic local reduction in the frequency and strength of our east winds and the dramatic increase in side-onshore wind direction is not reflected in the data from the James Campbell weather station, located upwind from the Kahuku Wind Farm. We have two scientific-grade wind sensors en route to Hawaii, and we would be happy to collaborate in partnership with the Kahuku Wind Farm or Champlain wind energy companies to give further study to the subject. It’s worth noting we’ve tried and failed to make contact with Kahuku Wind Farm’s current owner: NRG purchased SunEdison’s Hawaii holdings, but Charlie Toguchi, who introduced himself to the North Shore Neighborhood Board as NRG’s representative, informed us by phone on February 10, that NRG is not involved with the Kahuku Wind Farm. Since we plant to prepare and request an ordinance requiring the Kahuku Wind Farm (and Na Pua Makani Wind Farm, should it be constructed) to feather rotor blades under certain easterly wind and buoy swell conditions, it seems it would be beneficial for the wind farm(s) to coordinate closely with us, so we’ll continue to work to make contact with the Kahuku Wind Farm’s new owner
.———————————
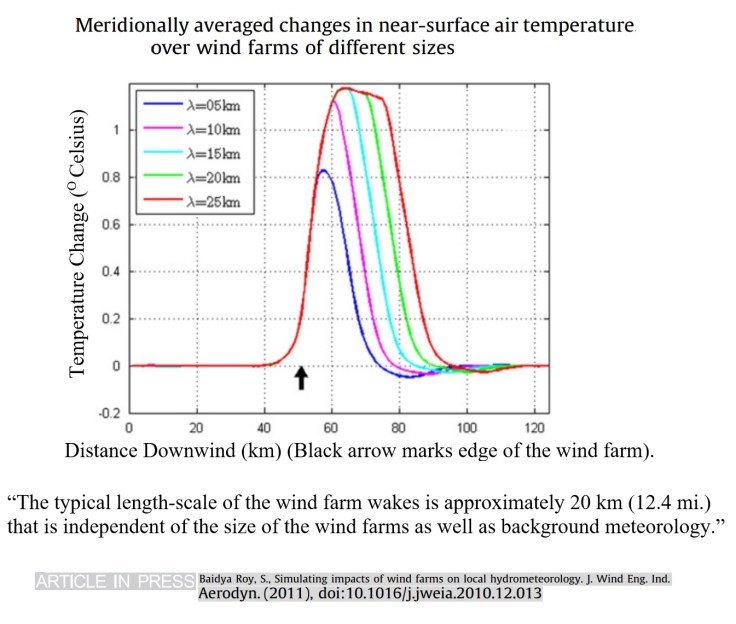
March 12, 2017 post-script: Dear wind developer, Sop denying wind farm effects reach many miles downwind from the wind farm (we sent the following graph to the email distribution list:
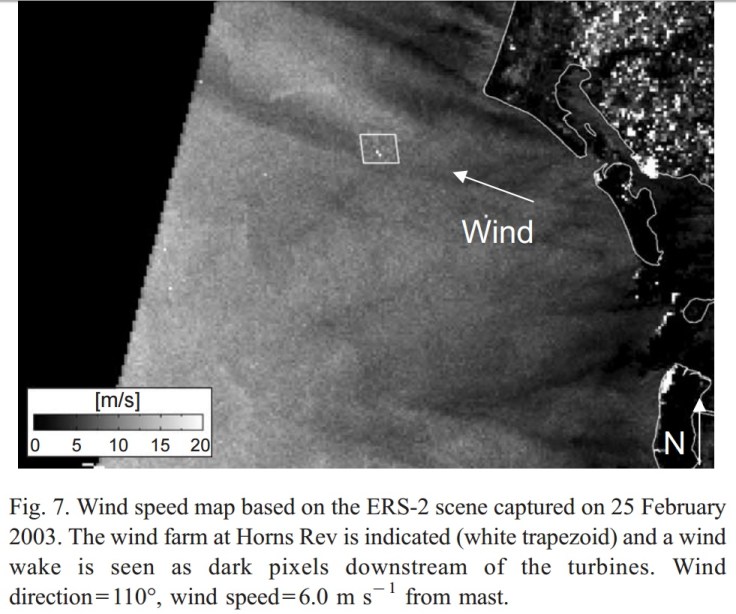
March 13 Email to wind developer: Aloha, The attached 2005 publication [from Remote Sensing of the Environment] will help you visualize the loss of wind speed many miles downwind from wind farms:
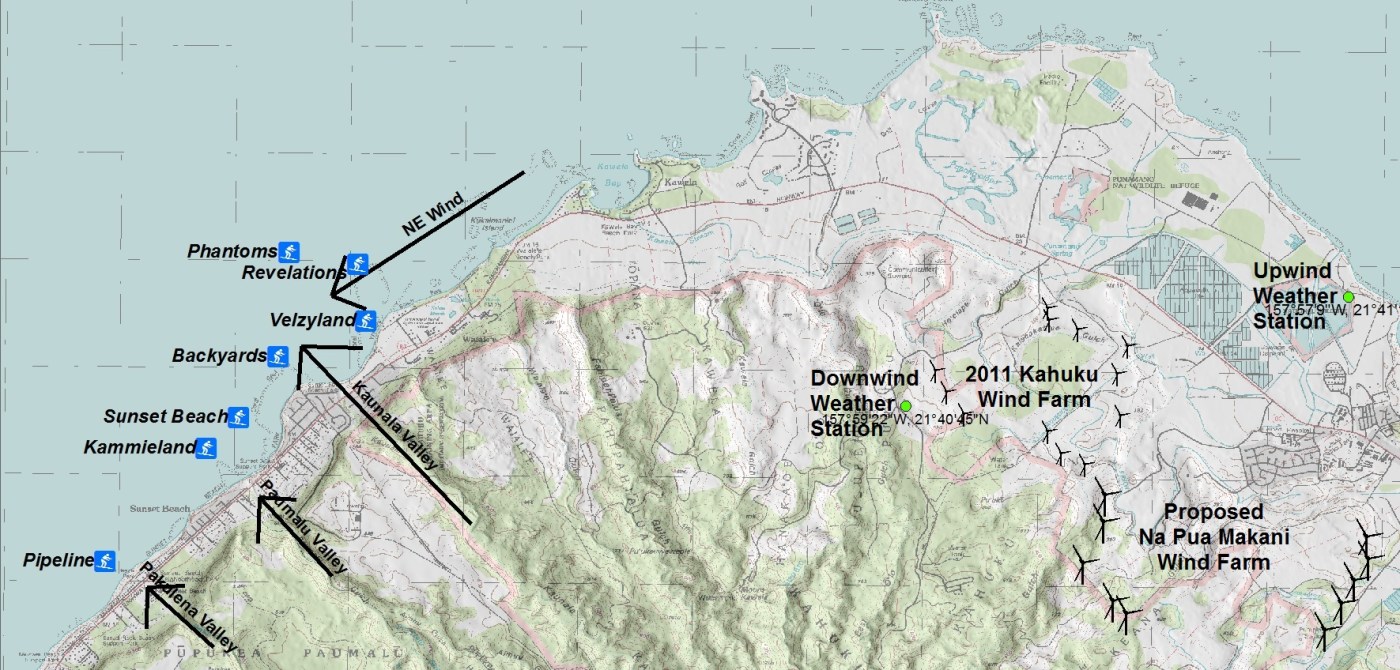
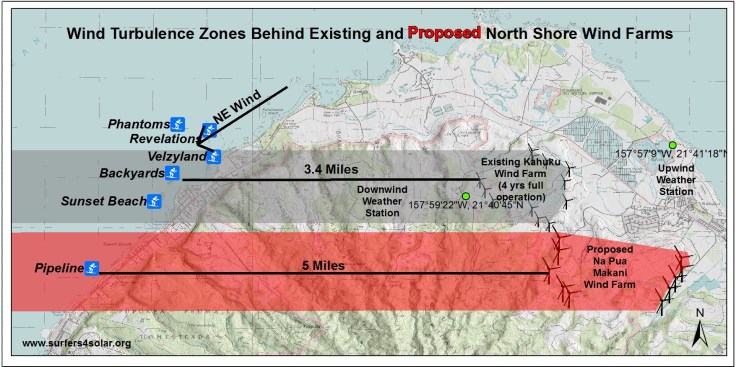
For Comparison with the map above, here are our local wind farms, surf spots, and distances:
Our Next Steps: Please consider making a donation to protect the North Shore from Wind Farm development at http://www.keepthenorthshorecountry.org/donate/
